
|
Physical Map of Australia |
Topographical Map of Australia |
Map of indigenous language groups in Australia |

Globes displaying latitude and longitude lines along with the Equator and the Prime meridian.
Horse latitudes are regions noted for their lack of winds. They lie at about 30° north and 30° south latitude, between the belts of the trade winds and the prevailing westerlies. Sailors were the first to call these regions the horse latitudes, perhaps because many horses died on sailing ships delayed there by the lack of wind. In the horse latitudes, the air tends to sink toward the earth's surface, and rainfall is light. Most of the world's major deserts, including the Australian Desert and the Sahara in northern Africa, lie at the horse latitudes.

Line graphs show information as a series of points to form a line. The line shows a trend or change over time. The horizontal axis will usually show units of time and the vertical axis will show amounts.

Pie graphs are shaped like a circle and are divided up so that the information being shown represents the slices of a pie. The circle of 360 degrees represents 100 percent and each of the slices is a percentage of that.

Climate graphs show the average monthly temperature and rainfall for a place over a year. Climate graphs combine line and column graphs. Temperature is recorded as a line graph and rainfall is recorded as a column graph.

Population pyramids are bar graphs that show the percentage of males and females in different age groups in a population. Younger age groups are at the bottom and older age groups are at the top. Percentages of males are placed on the left hand side and percentages of females are placed on the right hand side.

Mapping the movement of people in Covid-19 times.

username: Clonard
password: history

Click on the above image to go to Encyclopaedia Brittanica. From there you can access the Primary, Middle and High levels of Brittanica.
Brittanica online provides research materials including articles, images and videos.
Border Orientation Legend Title Scale Source
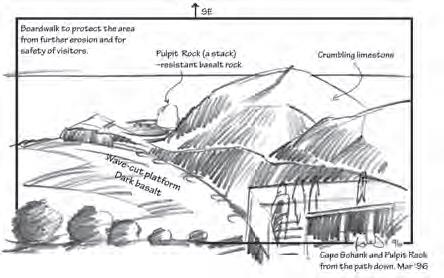
A field sketch is a grey lead outline of a physical feature or building. Foreground, middle ground and background can be shown by using line and shadow drawings. Annotations (labels) highlight significant features of the landscape or building. Field sketches are a great way to use observational skills to show your interpretations of a landscape feature.
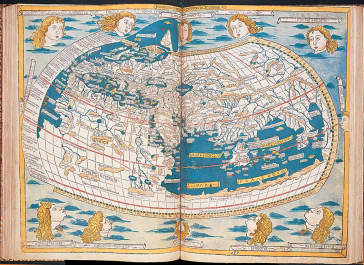
An early map of the world appeared in a 1482 edition of Ptolemy's eight-volume Geography. Ptolemy was a Greek geographer and astronomer who lived about A.D. 150. From Ptolemy's Geography,published in Ulm by Leinhart Holle (1482), Library of Congress


